Estimating Varietal Proportions in Wheat Grain Mixtures with Fine-Tuned Deep Vision Models
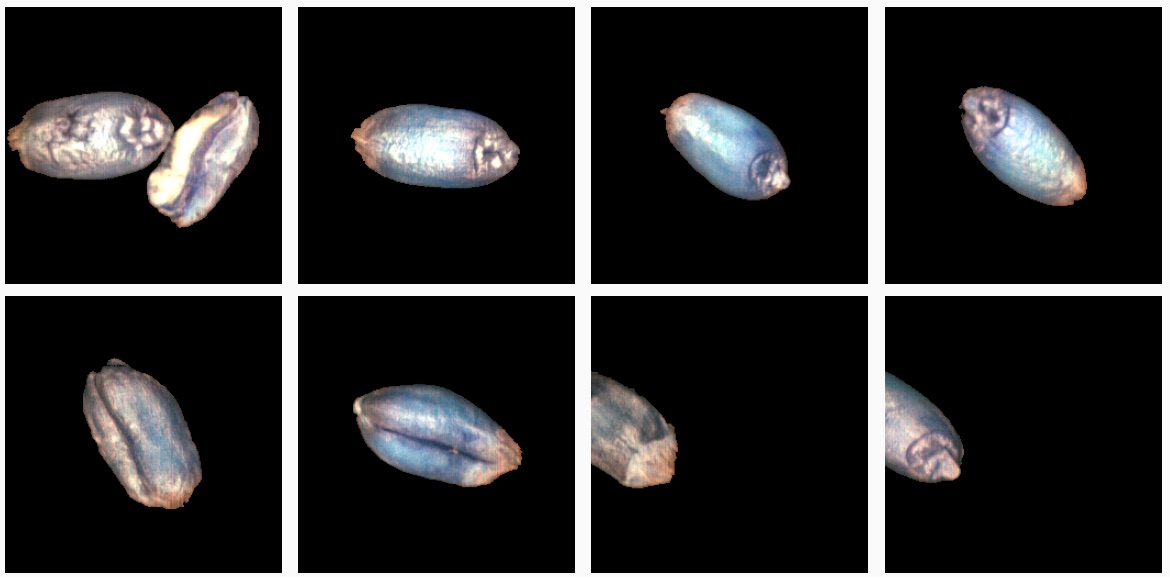
Growing several wheat varieties together in one field is a promising agroecological practice. To study it, you need to know how much of each variety ends up in the harvest. We classify individual grains from plain RGB photos to estimate those proportions.
The problem
Varieties of the same wheat species have grains that look almost identical. Research trials have relied on manual sorting, which farmers can't do at scale. DNA sequencing works but destroys the sample and is hard to parallelize. We asked whether a standard camera and a fine-tuned vision model are enough.
We had hyperspectral data (216 bands) but kept only the three RGB channels. That makes the data 72× smaller, the camera much cheaper, and lets us start from ImageNet-pretrained vision models.
Approach
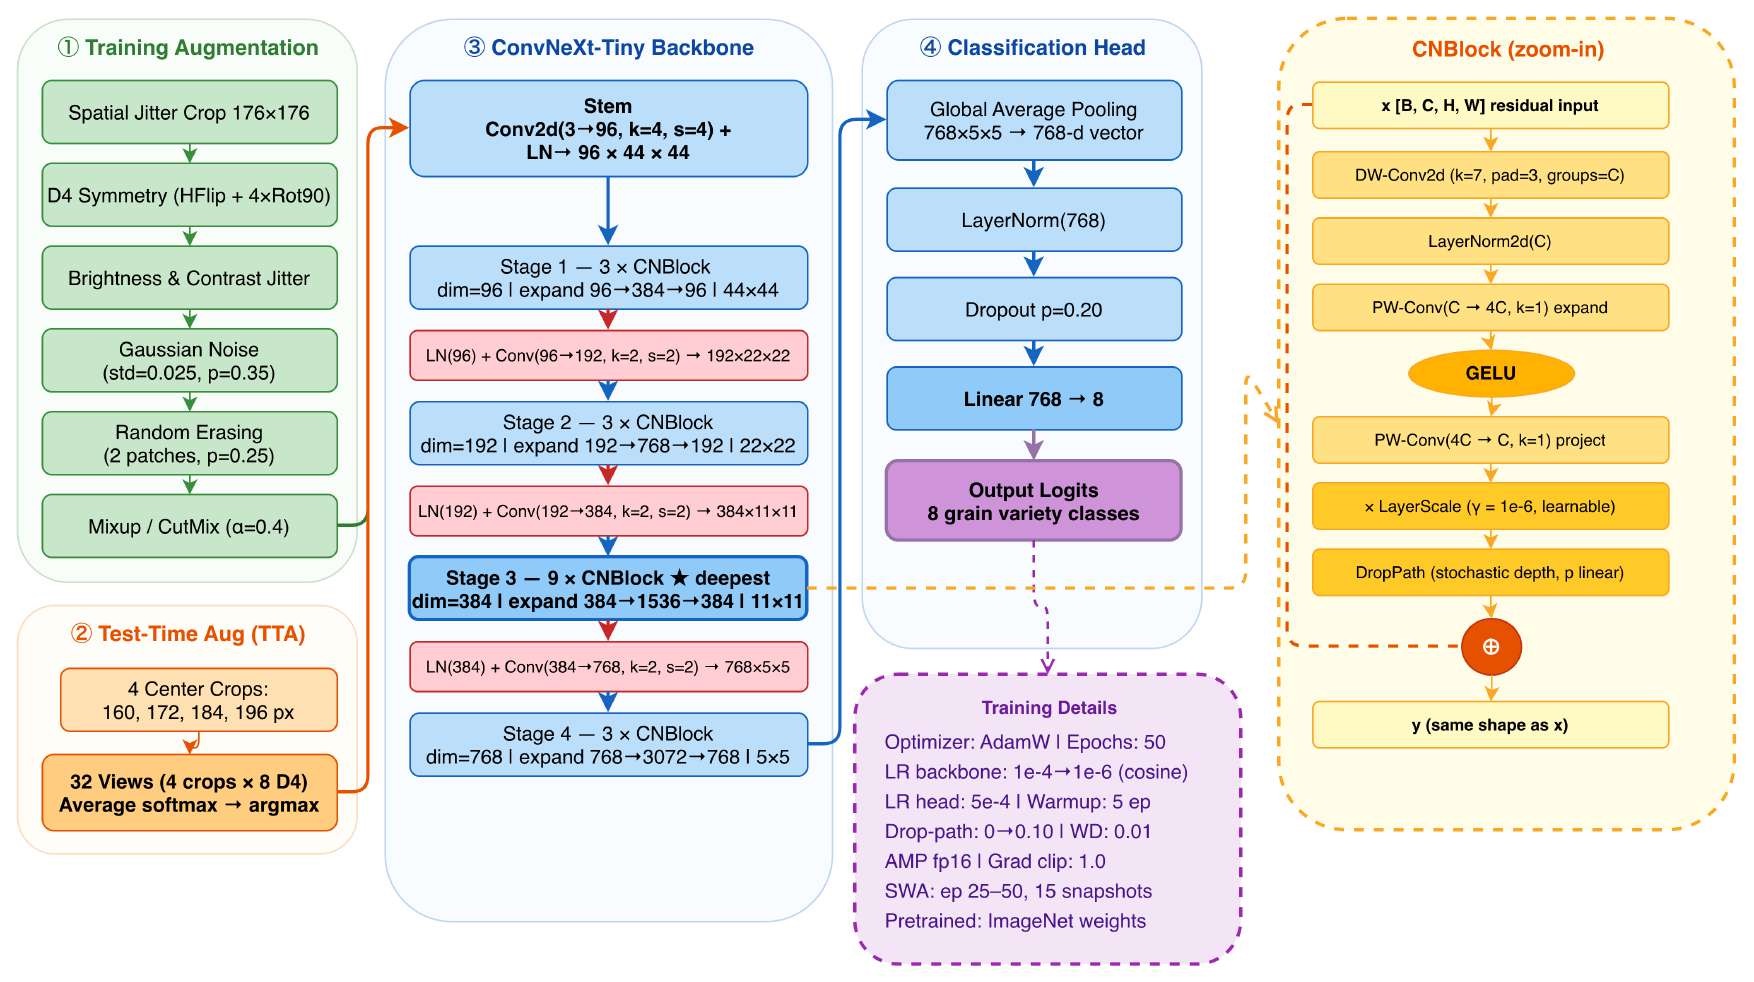
We fine-tuned five ImageNet-pretrained architectures end to end, backbone included: ResNet-18, EfficientNetV2-S, ViT-B/16, Swin-T and ConvNeXt-Tiny. Training uses AdamW with cosine annealing, heavy data augmentation (D4 symmetries, colour jitter, Gaussian noise, random erasing, Mixup/CutMix), label smoothing and stochastic weight averaging. At test time we average predictions over 32 views of each grain.
Results
| Model | Native Y1 | Native Y2 | Params |
|---|---|---|---|
| ConvNeXt-Tiny | 0.944 ± 0.003 | 0.945 ± 0.002 | 28.6 M |
| Swin-T | 0.935 ± 0.002 | 0.931 ± 0.003 | 28.3 M |
| EfficientNetV2-S | 0.934 ± 0.003 | 0.938 ± 0.002 | 24.0 M |
| ViT-B/16 | 0.908 ± 0.003 | 0.911 ± 0.002 | 86.6 M |
| ResNet-18 | 0.853 ± 0.008 | 0.860 ± 0.004 | 11.2 M |
Balanced accuracy, 5-fold cross-validation. Each model fine-tunes in about 10 minutes.
- Proportions: we simulated harvests for all 28 variety pairs at mixing ratios from 5/95 to 95/5, with 400 bootstrap repetitions each. The worst-case error is about ±4%, at the extremes. The model is also well calibrated without any correction.
- Year-to-year shift is large: a model trained on year 1 and applied directly to year 2 drops to about 33% balanced accuracy, against 12.5% for chance.
- Fine-tuning beats feature extraction: retraining only the classification head on year-2 labels recovers 89%, while full fine-tuning reaches 94%.
My contributions
- Methodology and software for the deep-learning classification pipeline.
- Visualisations and parts of the original draft.
- Preparing the public Codabench challenge built on the dataset.